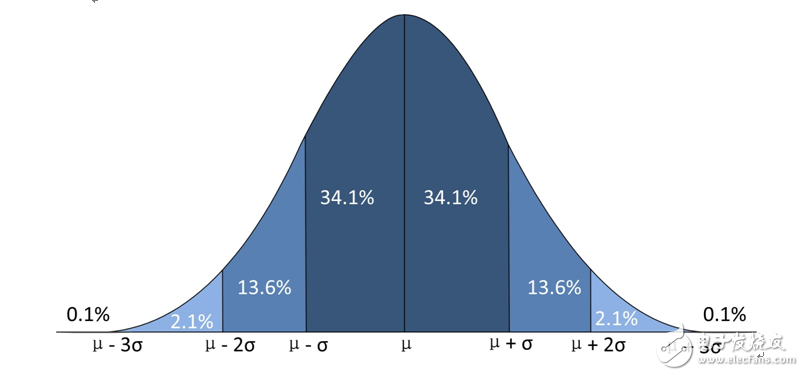
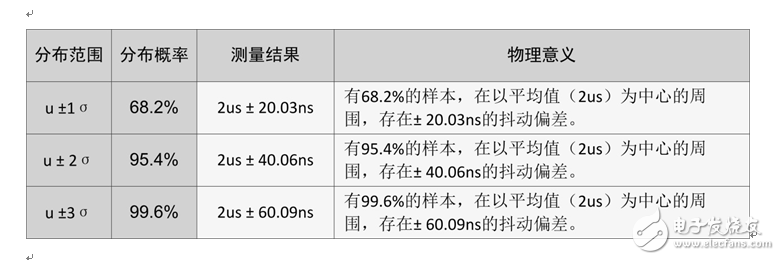
Abstract: The standard deviation is mentioned, the science man has a headache, the liberal arts woman is dizzy, and the dry formula is evasive. In this issue, we will break away from the complicated formula calculations in the past, and explain the essential meanings in a simple way, so that they can dominate the parametric measurement. In the oscilloscope's parameter measurement statistics, there is a little-known statistical result - standard deviation (Stdev). In this issue, we go from deep to shallow, and understand it from the objective point of view. Take a square wave signal with a period of 2us (frequency 500KHz) as an example. As shown in Figure 1, the measurement results of the "cycle" are shown. The "Stdev" standard deviation is very familiar but strange. It seems that it Existence is superfluous, but it is not. We will first introduce a concept of "normal distribution." Note: The measured square wave signal is generated by a function generator with a frequency of 500 kHz and a period of 2 us. The period jitter satisfies the normal distribution with a theoretical standard deviation of 20.0887 ns. Figure 1 Frequency 500KHz square wave measurement statistics The normal distribution is a random distribution with certain regular characteristics. The fluctuation range of the data from the mean and the distribution of the probability of the fluctuation can be determined according to its standard deviation. As shown in Figure 2, the probability of normal distribution is centered on the average, where: Falling at 1 standard deviation [the probability of the region is 68.2%; Falling at 2 standard deviations [the probability of the region is 95.4%; Falling at 3 times the standard deviation [the probability of the area is 99.6%, Ø “u†is the average value, corresponding to “Avg†in the oscilloscope statistical results; Ø “σ†is the standard deviation and corresponds to “Stdev†in the oscilloscope statistics. Therefore, most of the circuit signals have accidental errors, and the accidental errors obey the normal distribution. Therefore, in the oscilloscope measurement, we can analyze the fluctuation range of the signal from the average value and the distribution of the fluctuation probability according to the measured standard deviation. Figure 2 Normal distribution probability The standard deviation (Stdev) measurement we see on an oscilloscope is actually 1 standard deviation (1σ). With reference to the normal distribution curve, it is not difficult to understand the physical meaning of the standard deviation. Note that the standard deviation has no fixed unit, and its unit is consistent with the measurement item in the statistics. The standard deviation of the period measured in this example is 1σ=20.03ns, which is very close to the expected value of the function generator σ=20.0887ns, indicating that the measurement result is correct. The physical meaning of the measurement result is listed in Table 1. Table 1 Physical meaning of standard deviation Summary : Through the results of the oscilloscope's measurement statistics, we can have a general assessment of the quality of the signal under test, such as the periodic jitter of the signal in this example. There are several factors that affect the measurement when measuring statistics. Pay a little attention. Ø Sampling frequency: The higher the sampling rate, the finer the resolution and the higher the measurement accuracy; otherwise, the measurement accuracy is low. Ø Sample size: The more samples the parameter counts, the closer the actual situation is, the more accurate the statistical results are; the large number of samples are helpful to improve the average accuracy, and can also compensate for the accuracy impact caused by the low sampling rate under certain conditions. At present, many oscilloscopes on the market are performing sample point extraction, extracting one piece of data or one period of data for measurement, which affects the sampling frequency and reduces the number of samples, resulting in lower measurement accuracy. However, the ZDS2024 Plus oscilloscope supports the "true" measurement statistics of the 250Mpts full-preservation depth raw sample points. The so-called "true sense of measurement" is based on all the original sampling points, without any sample extraction, full memory depth measurement, even at 1GSa / s, 250Mpts sample points are all measured and statistical. Therefore, the "real sense measurement" of the ZDS2024 Plus oscilloscope can quickly measure and count large sample data under high sampling rate. For example, in this example, at 1GSa/s sampling rate, the graph is completed in a few seconds. The statistics of the “11.22M†sample point in 1 is more than 10 million periodic samples, which leads to a more accurate standard deviation, which is more conducive to analyzing the fluctuation of the signal. The Piezoelectric Ceramic sound-generating element, especially a lead-free piezoelectric ceramic sound-generating element, is mainly composed of metal flakes and piezoelectric ceramic flakes. The sound pressure generated by this new structure piezoelectric sounder is proportional to the number of piezoelectric ceramic sheets. By increasing the number of piezoelectric ceramic sheets, the required large sound pressure is easily achieved. Custom Piezoelectric Components Custom Piezoelectric Components,PZT Elements Soldered Wires,Element of Piezoelectric,Piezoelectric Elements Crystal Zibo Yuhai Electronic Ceramic Co., Ltd. , https://www.yhpiezo.com