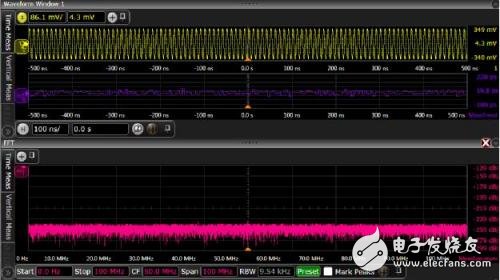
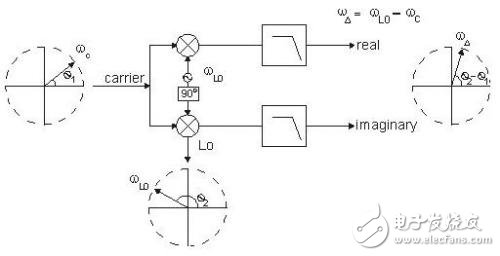
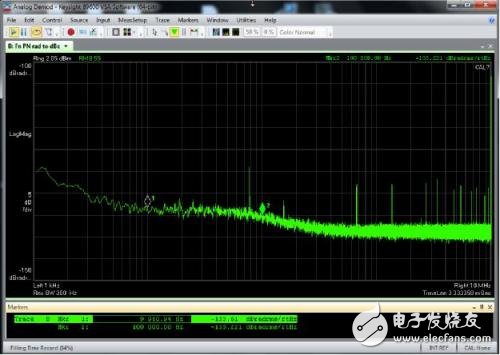
Wikipedia defines phase noise as: "Fast, short-term, random fluctuations in the frequency domain, caused by instability (jitter) in the time domain." The definition of the term noise means that the term does not involve any spurious terms. Or determine the item. The term "short-term" in the above definition is intended to distinguish this definition from other ways of determining the purity of the clock source, such as per million stable points, or ppm. The latter is usually measured over a longer period of time, such as seconds or minutes. The phase noise is usually expressed in a logarithmic frequency diagram, such as the following figure (Figure 1), where the amplitude is in dBc/Hz (the ratio of decibels to 1 Hz bandwidth carrier power). The x-axis represents the frequency offset relative to the nominal signal or "carrier" frequency. figure 1 Before explaining how to measure phase noise using an oscilloscope, it's a good idea to understand why you use a real-time oscilloscope. Instrumentation that specifically measures phase noise, such as the Keysight E5052B Source Analyzer (SSA), has a lower phase noise measurement noise floor than any oscilloscope. The SSA is capable of performing accurate measurements, closer to phase noise offset values, and faster than any oscilloscope. However, the instrument also has some measurement limitations, such as the requirement for the maximum frequency offset range. The typical maximum offset of the phase noise analyzer is 100MHz. For clock frequencies greater than 100 MHz, higher frequency offsets are sometimes measured, but this is beyond the measurement range of such instruments. But the oscilloscope can measure the phase noise that is passed to the data signal, not just the clock. The oscilloscope is simple to use if it is sufficient for measurement requirements, and is a good choice when budget is not enough to purchase a dedicated phase noise measurement device. The oscilloscope can capture and digitize the entire signal waveform. There are several ways to extract phase noise information from the digitized waveform. This article will briefly introduce two methods: 1, clock recovery 2. Perform phase demodulation by vector signal analysis software Perform phase demodulation by serial data clock recovery The oscilloscope analyzes whether the signal reaches a set voltage threshold and compares it to the reference clock edge to measure the timing variation (jitter) of the serial data or clock signal. For phase noise, we want the reference clock to be the ideal fixed frequency clock. Most modern oscilloscopes have a clock recovery algorithm that extracts the clock from the signal. In many cases, we want to implement phase-locked loop (PLL) emulation through an algorithm, but here we only need to extract an ideal clock for a fixed period, so we don't “follow†any phase changes like a PLL. An example of establishing a clock recovery is shown below. (Fig. 2) The algorithm can be set to adjust the nominal signal frequency and phase based on the results of each sample. figure 2 The oscilloscope's measurement of time interval error (TIE) establishes a time-series absolute time error for each edge relative to the ideal clock. To convert to phase (radian) error we only need to multiply by 2*pi*fc, where fc is the clock carrier frequency. Φrad=2*π*TIEt*fc The time interval error trend can be converted to frequency space by FFT, called the jitter spectrum. This feature is built into most modern oscilloscopes or can be implemented with options (Figure 3). image 3 To obtain a clear view of the measured phase spectral density, it is necessary to average the jitter power spectrum obtained by multiple sampling. The maximum frequency offset value (fj_max) obtained by the jitter spectrum method is equal to the carrier frequency (when the TIE includes rising and falling edges). The minimum frequency offset value (fj_min) is theoretically determined by the length of time the TIE samples. That is, the sampled frequency component must be greater than the reciprocal of the time between the first edge and the last edge of the TIE. #Pts=SaRatefφ_min It is difficult to measure phase noise by a real-time sampling oscilloscope here. A sufficiently high sample rate must be maintained to accurately measure the time edge, but in order to get low frequency content, a very large sample memory depth must be used for longer acquisition times. Example: SaRate = 80 GSa/s Fj_min = 100Hz Required memory depth = 800 MPts Each sample is processed by clock recovery, Fourier transform to establish the jitter spectrum, find the edge, and then average the multiple samples. The oscilloscope must have deep memory and the ability to process quickly. Now that we understand the basics of phase noise measurement, we still want to get results in dBc/Hz, as this is the convention for such measurements. Most phase noise plots have a logarithmic frequency scale that better displays near phase noise offsets. As an example, we build a TIE measurement in seconds instead of radians and then convert the unit to dBc as follows: Phase noise dBc= 20*log102*π*fc*jsrms(fφ) But please note that the phase noise above contains the energy on both sides of the carrier. One sideband (SSB) phase noise is commonly considered, that is, noise on a single sideband of the carrier spectrum, denoted by the symbol L. Therefore we must divide the above phase noise by 2, because L(fj) = 0.5*Sφ(fj), and divide by the square root of the jitter spectrum resolution bandwidth to normalize the bandwidth to 1 Hz. therefore: L(fφ) dBc/Hzpk= 20*log10π*fc*jsrms(fφ)rbw Examples of such measurements and conversions are as follows. (Figure 4) A high-purity 100MHz sine wave is measured here using the Keysight Infiniium DSAV334A oscilloscope and a software called Infiniium phase noise. Not only will the jitter spectrum be averaged, but smoothing and spurious cancellation techniques will be used in this application to better measure the random phase noise floor. Figure 4 Vector signal analysis software such as the Keysight 89600B can acquire data using a variety of hardware, including real-time oscilloscopes. The analog phase demodulation algorithm uses different working methods for serial data clock recovery, but the results are similar. Figure 5 is a high-level block diagram of how the 89600B VSA software performs phase demodulation. The ideal local oscillator (LO) mathematically mixes 2 copies of the digitized signal, one of which has a 90 degree phase difference from the other. The mixed signal eliminates high frequency mixing products by low pass filtering, leaving only phase (and frequency) errors. This can be displayed in a variety of ways including the phase spectrum. Figure 5 Chinese and English in the picture The VSA PM demodulation algorithm can be optionally equipped with an automatic carrier frequency and phase tracking algorithm as shown below (Figure 6): Figure 6 The automatic carrier frequency algorithm adjusts the clock frequency to the measured nominal signal clock frequency instead of the user input value (similar to serial data clock recovery). This frequency is recalculated for each new waveform acquisition. The automatic carrier phase algorithm also adjusts the nominal phase of the input signal for each acquisition. The figure below also shows a 100MHz pure sine wave measurement using the DSAV334A oscilloscope, but the VSA software controls the oscilloscope's sampling, phase demodulation, and phase noise spectral averaging. The results of the two demodulation techniques show perfect consistency. Figure 7 Different algorithms can be applied to the digitized waveform obtained by the real-time oscilloscope to recover the phase noise information and establish a phase noise map. Technical trade-offs are beyond the scope of this article, but we can say that using an oscilloscope for phase noise measurements is not only feasible but also very useful. In subsequent articles we will discuss the trade-offs and how to ensure accuracy when using real-time oscilloscopes for such measurements.
cool mint
1.Sakt Nicotine:5% 800puff vape,aim stick vape,aim plus vape,aivono aim plus.aivono vape. Shenzhen Ousida Technology Co., Ltd , https://www.osdvape.com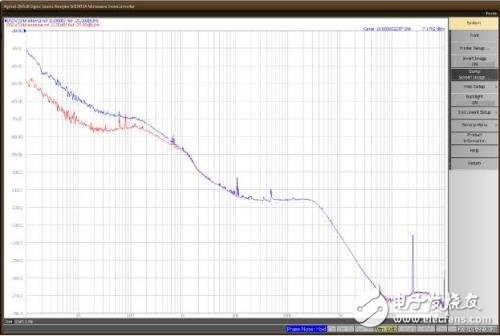


AIVONO AIM PRO vape is a small, compact disposable pod system with a 9ml capacity tank and a nic strength of 5% nic in each flavor. Each device contains around 2500 puffs and comes with a fully charged battery so you can start vaping immediately without the hassles of needing to charge the device.
Flavors:
lush ice
cotton candy
tangrine ice
strawberry watermelon
bluberry raspberry lemon
manba
mixed berry
peach ice
banana ice
Specifications
2.Puffs: 800
3.Capacity: 3.2ml e liquid
4.Battery: 550mah,13400 pure cobalt
5.10 pcs in a display box, 400pcs master case
What is phase noise?