Introduction to the basic architecture and architecture diagram of the data warehouse
Data warehouse, English name is DataWarehouse, can be abbreviated as DW or DWH. Data warehousing is a set of strategies that provide support for all types of data for all levels of decision making in the enterprise. It is a single data store created for analytical reporting and decision support purposes. Provide guidance to business process improvement, monitoring time, cost, quality, and control for businesses that require business intelligence.
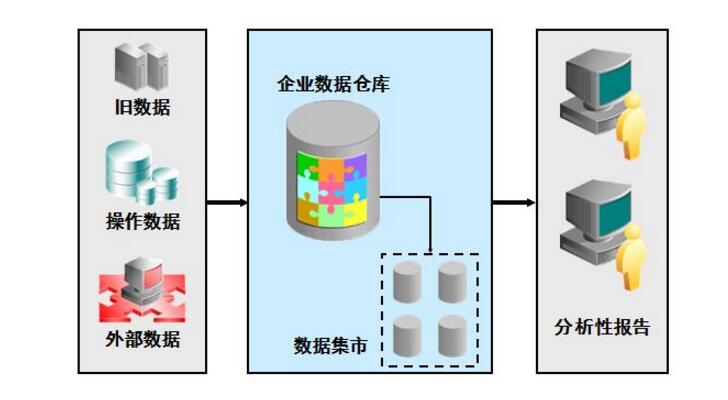
Use of data warehouse1. Integrate all business data of the company and establish a unified data center
2. Generate business reports for making decisions
3. Provide operational data support for website operations
4. Can be used as a data source for each business, forming a virtuous circle of mutual feedback of business data
5. Analyze user behavior data, reduce input costs and improve input efficiency through data mining
6. Develop data products that directly or indirectly profit for the company
1 Improve efficiency by data preprocessing, because there will be redundant data due to preprocessing
2 If the business rules of the business system change without tiering, it will affect the entire data cleaning process, and the workload is huge.
3 through layered management to achieve step-by-step work, so the processing logic of each layer is simple
Standard data warehouse layering: ods (temporary storage layer), pdw (data warehouse layer), mid (data mart layer), app (application layer)
Ods: the historical storage layer, which is isomorphic to the source system data, and the data granularity of this layer is the finest. There are two types of tables in this layer. One is to store the data that needs to be loaded currently, and the other is to use After storing the processed data.
Pdw: data warehouse layer, its data is clean data, is consistent and accurate, that is, cleaned data, its data generally follows the third paradigm of the database, the data granularity and the size of the ods are the same, it will save bi All historical data in the system
Mid: The data mart layer, which is the subject-oriented organization data, usually star-shaped and snow-like data, from the data granularity, it is the data of the light summary level, there is no detailed data, in terms of breadth It contains all the business volumes. From an analytical point of view, it is probably in recent years.
App: Application layer, data granularity is highly aggregated, not necessarily covering all business data, just a subset of the mid-level data.
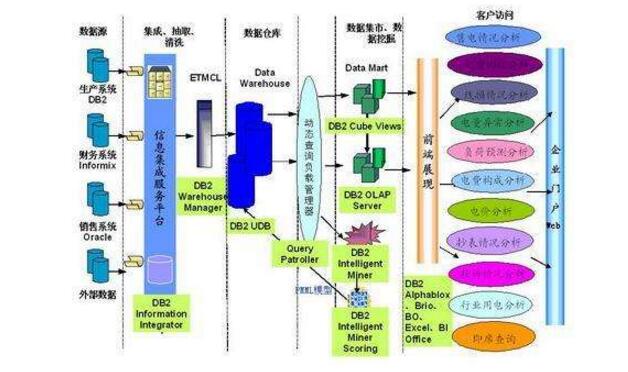
The task of the data acquisition layer is to collect and store data from various data sources onto the data store, during which it is possible to do some ETL operations.
There are many types of data sources:
Log: The largest share, stored on the backup server
Business database: such as Mysql, Oracle
Data from HTTP/FTP: Interface provided by the partner
Other data sources: such as Excel, data that needs to be manually entered
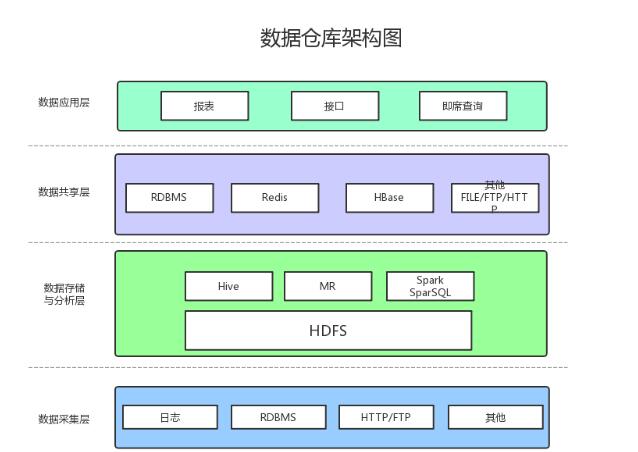
2, data storage and analysisHDFS is the perfect data storage solution for data warehousing/data platforms in big data environments.
Offline data analysis and calculation, that is, the part that does not require real-time performance, Hive is a good choice.
Using the Hadoop framework naturally provides a MapReduce interface. If you are really happy to develop Java, or are unfamiliar with SQL, you can also use MapReduce for analysis and calculation.
Spark performance is much better than MapReduce, and SiveSQL is used to operate Hive.
3, data sharingThe results of Hive, MR, Spark, and SparkSQL analysis and calculations are still on HDFS, but most services and applications cannot directly obtain data from HDFS, so a data sharing place is needed to make each service and product convenient. Get the data.
The data sharing here actually refers to the place where the previous data analysis and calculation results are stored. In fact, it is a relational database and a NOSQL database.
4, data applicationReport: The data used in the report is generally collected and stored in the data sharing layer.
Interface: The data of the interface can be obtained by directly querying the data sharing layer.
Ad hoc query: Ad hoc queries are usually the existing report and data sharing layer data does not meet the needs, you need to query directly from the data storage layer. It is usually obtained by directly operating SQL.
Ideal data warehouse architecture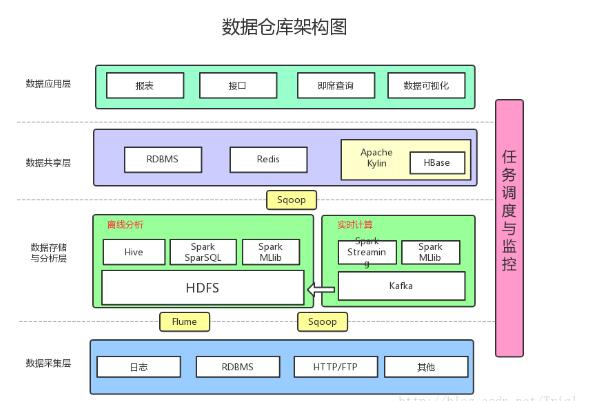
Added the following:
Data collection: Flume is used to collect logs, and Sqoop is used to synchronize data in RDBMS and NoSQL to HDFS.
Messaging: You can join Kafka to prevent data loss
Real-time calculation: Real-time calculation uses SparkStreaming to consume log data collected in Kafka, and most of the real-time calculation results are stored in Redis.
Machine Learning: Using the machine learning algorithm provided by SparkMLlib
Multidimensional Analysis OLAP: Using Kylin as an OLAP Engine
Data visualization: Provide visual front-end pages for non-developers to directly query
Inverter Shell,Mini Inverter Shell,Best Inverter Shell,Hybrid Inverter
Original Electronics Technology (Suzhou) Co., Ltd. , https://www.original-te.com