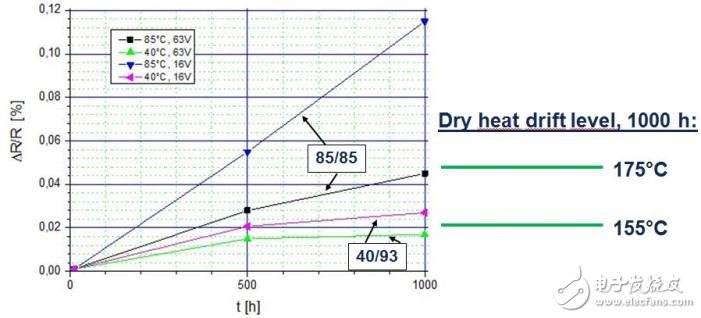
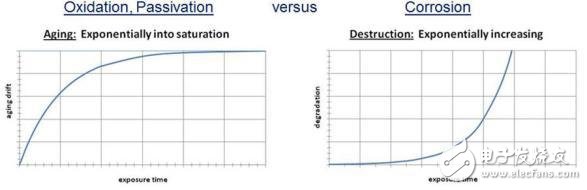
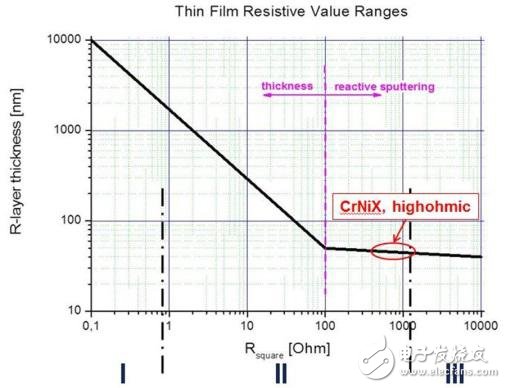
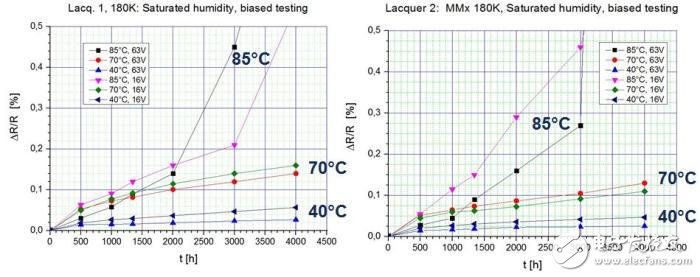
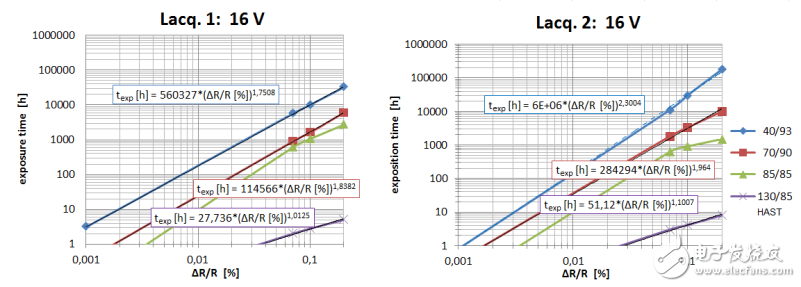
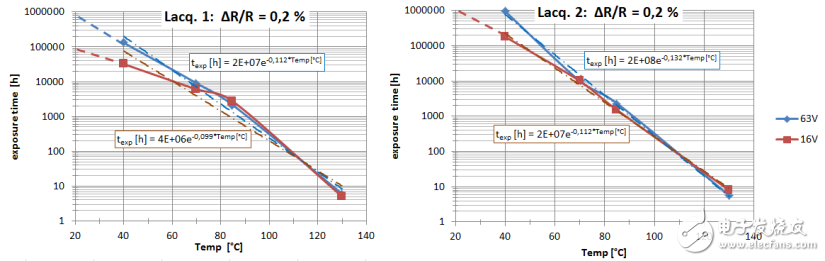
Abstract: In the past papers, the phenomenon that the resistance of the thin film resistor drifts with time is mentioned, and the situation is described under the condition of “dry heatâ€. However, the use of electronic equipment in places with high relative humidity or in applications is still a challenge for component reliability. Therefore, the industry standard AEC-Q200 requires passive components to be tested under the bias humidity test of 85 ° C / 85 % RH. The certified film resistors are suitably stabilized in R-layer and electrically insulating varnish and can pass the 85/85 test. The following problems will occur: (1) What does it mean for the actual application of the film resistance through the 1000-hour offset 85 / 85 test? (2) Under certain load and environmental conditions, is it possible to predict the worst-case resistance drift by using 85/85 test data or HAST data after a certain period of time? To answer these and other test-related questions, we conducted a long-term experimental comparison of the resistance at 40 °C / 93 % RH and 85 °C / 85 % RH, as well as the commonly used standard test conditions. Extend the time of these tests to 4000 hours using our most sensitive thin film resistor layer system at approximately 0.5% and 10% maximum calibrated operating power. In addition, we conducted tests at 70 °C / 90 % RH, 90 °C / 40 % RH, and HAST130, and studied the temperature and humidity linearity of the resistor and the effect of voltage on drift. . This article will illustrate the results of this comparative study, which allows us to answer the acceleration factor problems of temperature and voltage. These results will be compared to existing forecasting models. These findings provide the basis for designing a new model that covers all aging conditions, system characteristics, and component health predictions throughout the temperature-humidity-time domain. main content Develop and define a universal (offset) humidity acceleration and long-term prediction model for an electronic component and use this model to study sensitive thin film resistors. • The model takes into account the effects of heat and humidity on degradation, so that predictions can be made throughout the temperature-humidity-time domain. · The clear ln√t – 1 / T block diagram contains all the information that allows us to calculate the mold/paint and the data of all relevant materials on the functional layer (activation energy, humidity-related material properties, bias voltage) Acceleration effect, etc.). · There is a difference between aging/oxidation and corrosion. Inconsistencies between these contradictions can be eliminated by standardizing the exposure time and replacing the drift of the measured parameters. · Normally use the actual current vapor pressure as a definite physical rate, replacing the relative humidity rh. In our model, the role of rh is to estimate the actual rate of diffusion. · Find the diffusion characteristics of the electrical insulating paint or mold separately, as the main factors affecting the degradation of the components parameters due to temperature and humidity. 1 Introduction In the previous paper, how to predict drift under dry heat conditions in the relative temperature-time range of up to 175 °C has been described. The main finding is the time-varying phenomenon derived from Arrhenius's law, and the process constant Tstab. Based on the time-dependent Arrhenius equation, a predictive model is proposed to ensure safe and reliable operation of the device, with an estimated time of 200,000 hours or more. For applications that work in very important and harsh environments, the automotive industry places higher goals on reliability. In addition to the 40 °C / 93 % RH test that has been standard since many years ago, the offset 85 °C / 85 % RH test has become a mandatory requirement for standard certification and automotive passive components. In particular, the details of the interaction and degradation mechanisms of passive components are quite ambiguous. In many seminars and releases, component manufacturers have stated that 85/85 testing is too difficult for their dedicated components (eg AEC-RW 2012: Polymer-C; AEC-RW 2008: Tantalum-C, after 168 hours of 85 / 85 test). What the device means for 85 / 85 for long-term use (such as 17 years of product life, 5,000 to 7000 hours of operation at the rated voltage), the automotive industry is confused. Therefore, the problems and requirements for predictive models of passive components have followed, especially resistance. Since the Lawson equation is still the dominant method for predicting active devices, one might ask whether Lawson predicts whether the model is also suitable for wet aging and degradation of resistors. Many open-ended questions have prompted us to recapture the prediction methods of thin film resistors that we have studied and published. So far, there are no suitable models for these problems. We can test how to take the bias humidity phenomenon into account, or do Better, can be integrated. 2. Bias humidity: aging or corrosion effects Tests have shown that the results of excessive moisture testing vary widely due to differences in heat, especially in wet conditions. The difference in test results is shown in Figure 1 after 1000 hours of exposure in a humid environment. Figure 1: Differences in test results These facts contain many open questions: · Why does the test temperature increase by only 45K, and the effect of bias humidity is so large? · Why is the sheet resistance more sensitive to bias humidity than dry heat? · Why does a higher voltage result in lower drift? · What is the acceleration mechanism for degradation in the bias humidity test? · Is there a suitable way to estimate and predict the resistance drift after the biased humidity stress? The original 85/85 test was designed to accelerate the penetration of moisture into the unsealed IC package to initiate corrosion failure in the metal layer. When evaluating test results, it should always be clear whether the test results are caused by (predictable) aging processes or by (destructive) degradation. This way we can completely distinguish between oxidation/passivation effects and corrosion mechanisms. Figure 2 shows the basic difference between parameter drift caused by these two reasons. Figure 2: Oxidation/passivation and corrosion mechanisms 3. In-depth study of the test program Our test plan takes into account the following factors: · Use certified sensitive film resistance values ​​in accordance with AEC-Q200 (same batch, laser trimming of all tested variants); · Compare bias humidity 85 / 85 test results with 40 / 93 test results; · Introduce two intermediate test states of 70 ° C / 90% RH and 90 ° C / 40% RH; · Extend the test or exposure time to 4000 hours (10,000 hours); · Use two different electrical insulating varnishes; · Apply two voltages/loads on each variant (from 10% to 30% of the rated voltage, using the bias humidity test, certified according to the requirements of standard automotive components); · Compare bias test and HAST 130 (high acceleration stress test: 130 ° C and 85% RH bias humidity test, same batch and electrical status) results. It is important to note that both lacquers are fully certified and released in accordance with industry requirements for 85 / 85 (that is, we have only conducted basic research on available samples in accordance with industry standards). Another important point is that samples must be taken from the most sensitive range of resistance values. Figure 3 shows the critical edge of the thin film electronics design, which can be used for reference. Figure 3: Resistance layer thickness for different resistance values The entire resistance range of the square resistor Râ–¡ is determined by three alloys (I, II and III). Alloy II uses CrNiX (X stands for the third element). R â–¡ between 1 Ω and 100 Ω is achieved by changing the thickness of the resistive layer from 2 μm to 30 nm. When oxidation and corrosion occur simultaneously, changes in the resistive layer can cause different effects. Surface or grain boundary effects can occur with thicker resistive layers. Instead, we must face the volume effect that occurs on the thin resistive layer, which can affect the thickness of the entire layer. In the case of oxidation, all resistive materials are affected. In the case of corrosion, this can lead to complete destruction of the resistive layer. In order to do the test, we selected such sensitive samples to ensure the worst case of the sample (the resistance type is MINI-MELF, MMA0204, the maximum resistance is 180 kΩ, and Râ–¡ is about 800 Ω). Each measurement point was obtained from a single result of 20 test samples. In order to achieve a statistical coverage of 98% of all events (worst cases), the probability distributions of the parameter values ​​for each test point are evaluated. 4. Test results and main findings The test results for two different electrically insulating varnishes and two different bias voltages are shown in Figure 4. We found two distinct degradation mechanisms that can distinguish between aging (40 / 93, 70 / 90) and destructive corrosion conditions (85 / 85). Figure 4: Test results after 4000 hours of exposure in a test environment (40 / 93, 70 / 90, 85 / 85) At this stage, it is not possible to make comparisons or predictions based on the 85/85 test data. Therefore, in order to use comparable data, we proposed a method for normalizing all resistance drifts at a low drift level of ΔR / R from 0.07% to 0.1% to 0.2%. By defining an acceptable and virtually undamaged acceptable drift level within the standard requirements, we can compare all test data and add HAST 130 test results. The results of the standardized parameter drift (in our case ΔR / R) and the corresponding exposure time are shown in Figure 5. The standardized measurement points for exposure time are either derived directly or derived from 120 independent ΔR / R drift measurements by our different humidity tests. Figure 5: Standardization of test results at non-destructive ΔR / R levels The drift of each parameter is completely defined from the square: amplitude, system/material relationship, acceptable values ​​within the specification, and estimated component life expectancy. For a 180 kΩ thin film resistor, we define and select ΔR / R of ≤ 0.2% (we estimate that only the oxidation of the edge of the particle changes the conductivity and there is no volume effect on the material layer). The test data for the converted first paint and the second paint are shown in Figure 6 (at this stage, the estimated RH settings are slightly different, but not related). Especially at lower temperatures, the lacquer changes are noticeable. The curve may match the exponential function, but the match is not very good, especially the first paint. Figure 6: Comparing the test results of two paints
Deluxe
Rice Cooker was one of electric type rice cooker , but it`s the most popular type of electric
rice cooker . especially famous in Southeast Asia area with its good
appearances with various functions. Not only its outer shell could be
customized with different demands, but also it speeding cooking , saving times and electricity, enhancing our
lifestyle
Features
The
inner pot is made of solid and durable aluminum alloy of high intensity , such as non-stick inner pot , stainless
steel inner pot and honeycomb patterned inner pot with non-stick coating.
There are some models that use stainless steel instead of
aluminium .Various other materials, such
as copper, pure carbon, ceramic, and diamond powder coating, may be used for
higher heat conductivity or better taste.
Applications
Multifunction , can cooking rice, soup and much
more. added cooking versatility with supplied steam tray.
Some rice cookers have settings for congee, a type of
rice porridge called okayu in
Japanese, Juk in Korea, and zhou in Chinese.
More elaborate recipes are possible using a rice cooker, and there
are cookbooks devoted entirely to dishes prepared using a rice cooker. It is possible to cook soups, stews or
sponge cakes in electric rice cookers. By
simply adding ingredients and setting it to "warm", a rice cooker
cooks the contents at about 65 °C (150 °F). In a few hours, the stew is fully
cooked and ready to eat.
Deluxe Rice Cooker Deluxe Rice Cooker,Cylinder Rice Cooker,Mini Rice Cooker,Stainless Steel Rice Cooker Guangzhou Taipeng Electrical Appliances Technology CO., LTD. , https://www.kettles.pl